This newly updated infographic highlights the most important branded content benchmarks for marketers.
There’s a reason why Pressboard’s unofficial motto is ‘we believe in stories, not ads.’ Whether spoken, written, photographed or filmed, stories are a powerful bonding tool. Storytelling is how we make sense of the world around us — but more importantly, it’s how we connect with and build empathy for others.
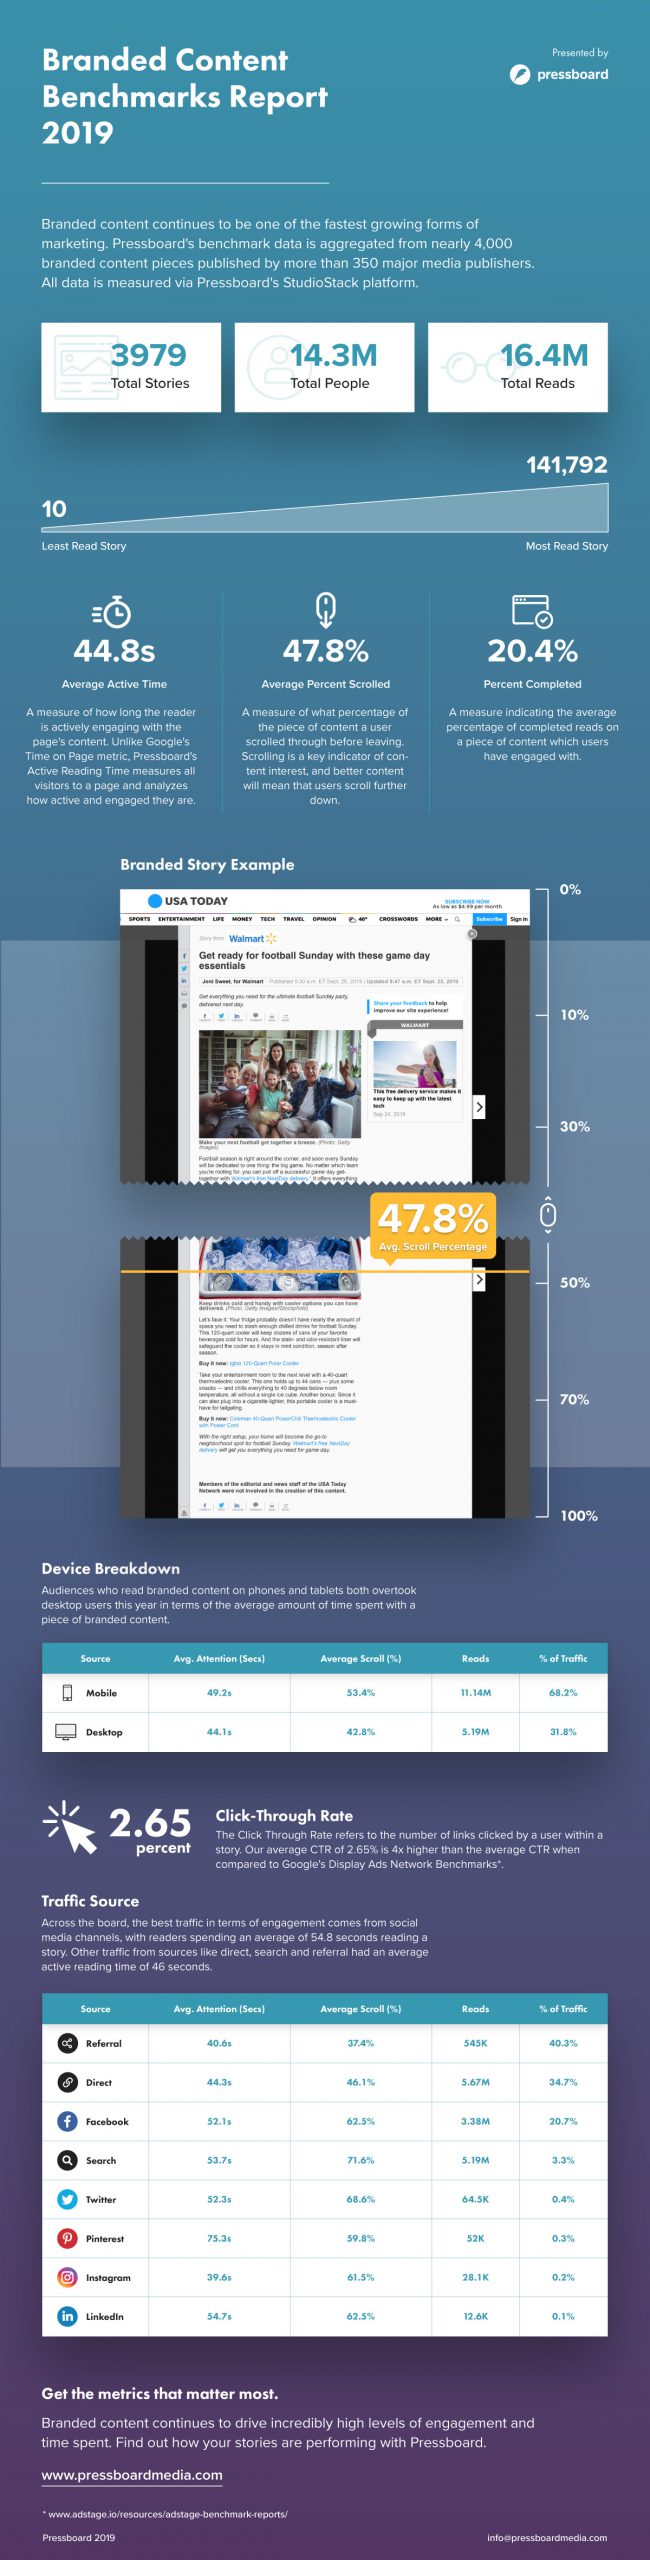
Our team’s belief in the power of a well-crafted story is what motivated us to build a platform that makes it easier for brands to team up with publishers to create and measure branded content. We’ve worked with over 350 digital publishers across North America to distribute content to millions of people, which has given us a constantly growing database of information on how branded content actually performs.
–
Since releasing our first Branded Content Benchmarks Report in 2016, we’ve received positive feedback from marketers and media companies across the globe who found our data useful for evaluating their own branded content campaigns.
This year’s report uses data pulled from nearly 4000 pieces of sponsored content created through Pressboard’s platform to show how the content performed overall. This 2019 report aims to go beyond mere data and impressions, however; its goal is to help marketers better understand the metrics and benchmarks they should be using to measure branded content.